
The Full Picture
Sharing stories and strategies on building businesses, investing capital, and the personal side of wealth
By Panoramic Capital Partners
It’s Not What You Make, It’s What You Keep
Everyone in this business talks about returns. Your portfolio was up 8%, or 11%, or 4%. The number gets compared to a benchmark, to last year, and occasionally to what someone at a dinner party claims to have earned. What almost nobody discusses with the same enthusiasm is the portion of that number you actually get to keep.
That is worth focusing on, because the second figure is the only one that buys anything. No one has ever paid for retirement, a grandchild’s education, or a place at the beach with a return before taxes. The industry reports and benchmarks and celebrates the pre-tax number, while the after-tax number is left to be handled each April 15th.
Two portfolios can produce identical results on a statement and can leave two investors with materially different amounts of spendable wealth a decade later. The difference has nothing to do with the investment selection in either one. It has everything to do with what kind of income each portfolio generated and when each chose to realize its gains. The first is a question of markets, which nobody controls. The second is a question of portfolio construction, which we can control.
Where the Dollar Came From
The tax code does not regard a dollar of investment income as simply a dollar of investment income. It asks where the dollar came from, and it charges accordingly.
Interest from a corporate bond or a money market fund is ordinary income, taxed at the investor’s top rate. Qualified dividends and long-term capital gains receive their own lower schedule. Municipal bond interest is generally free of federal tax, and bonds issued within the investor’s own state are frequently free of state tax as well.1 Certain distributions from private real estate and infrastructure partnerships are sometimes treated as a return of the investor’s own capital, which is not taxed in the year received. It instead reduces cost basis, postponing the liability rather than eliminating it.
Consider $1,000 of income for a household at the top federal bracket. As taxable interest, at the 37% top ordinary rate plus the 3.8% net investment income tax, roughly $592 is left.2 As a qualified dividend or long-term gain, at 20% plus that same 3.8%, roughly $762 is left.2 In-state municipal interest is not taxed at all, so the full $1,000 stays put.
FIGURE 1
What $1,000 of investment income is worth after federal tax
Top federal bracket, by character of income
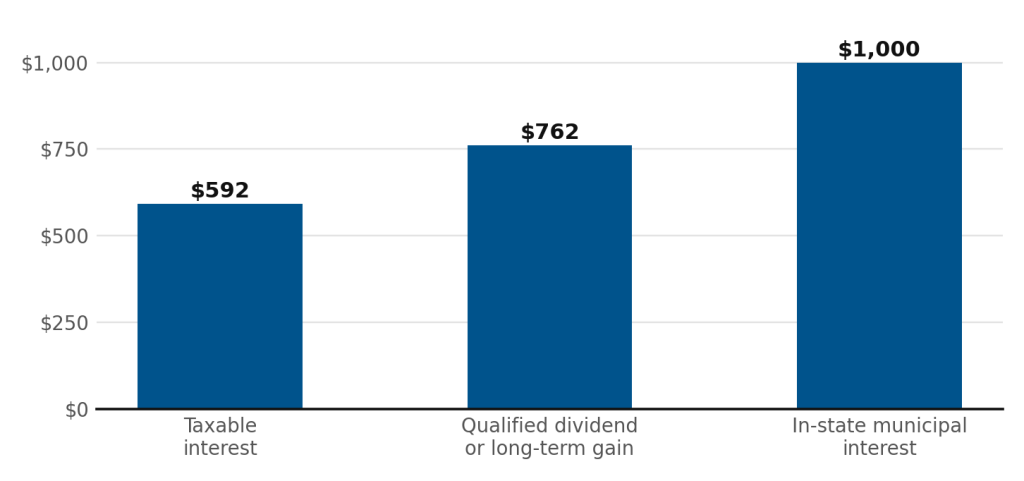
Note: Hypothetical illustration. Assumes the 37% top federal ordinary rate and the 20% top long-term capital gain rate, each plus the 3.8% net investment income tax. Computed as $1,000 less tax at each rate. State tax is excluded and varies widely; see Figure 2. Municipal figure assumes bonds exempt from federal tax and, for a resident of the issuing state, from state tax as well. Distributions characterized as a return of capital are not shown here because their character is determined annually by the issuer rather than by statute; that treatment is discussed later in this article. See footnotes 1 through 3.
Source: Internal Revenue Code; Panoramic Capital Partners calculations.
State tax widens each of those gaps, by an amount that depends entirely on the investor’s zip code. Top state rates on investment income run from nothing at all in a handful of states to the low teens in the highest.3 The chart below shows federal tax only. An investor in a no-tax state can read it as it stands. An investor in a high-tax state should understand every gap in it as wider than pictured. The second chart shows where the states actually fall at both ends of the range.
Nothing in that comparison represents a better investment. The $1,000 is the same $1,000. Only the manner in which it was earned has changed, and that alone accounts for a spread of just over $400.
FIGURE 2
Top marginal state income tax rates
Highest and lowest states, as of Jan. 1, 2026
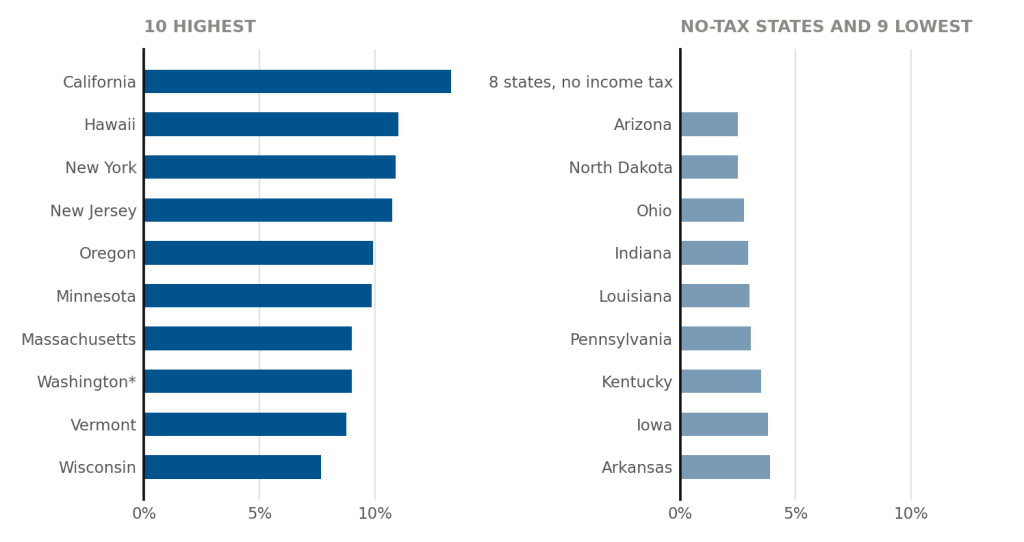
Note: Top marginal rates on ordinary income for single filers. Washington taxes capital gains income only. Missouri exempts capital gains from its income tax. Local income taxes excluded. The District of Columbia, not a state, would rank among the highest at 10.75%. Maine is next highest at 7.15%; North Carolina next lowest at 3.99%. The eight states with no individual income tax are Alaska, Florida, Nevada, New Hampshire, South Dakota, Tennessee, Texas and Wyoming. See footnote 3.
Source: Tax Foundation, State Individual Income Tax Rates and Brackets, 2026.
Municipal bonds are where that chart becomes practical. The federal exemption applies to every investor equally; the state exemption does not. In a no-tax state, in-state bonds add nothing, so the whole national market is available on equal terms. In a high-rate state, they add a second layer of exemption worth real money, at the cost of concentrating credit exposure in one state’s issuers. In between, it is a tradeoff rather than a rule.
A Small Difference, Repeated for 20 Years
Here is the part that seems most underappreciated. A single year of tax drag is almost imperceptible. Compounded across an investing lifetime, it becomes one of the largest determinants of the final result.
Take two hypothetical portfolios, each earning 7% a year before taxes on $1 million for 20 years. The first surrenders 1.5 percentage points annually to taxes and compounds at 5.5%. The second earns the identical return before taxes, pays closer attention to the character of its income and the timing of its gains, surrenders half of one percentage point, and compounds at 6.5%. After 20 years the first is worth roughly $2.92 million. The second is worth roughly $3.52 million. The gap is about $606,000.4
FIGURE 3
One percentage point a year, over 20 years
Hypothetical growth of $1,000,000 at a 7% return before taxes
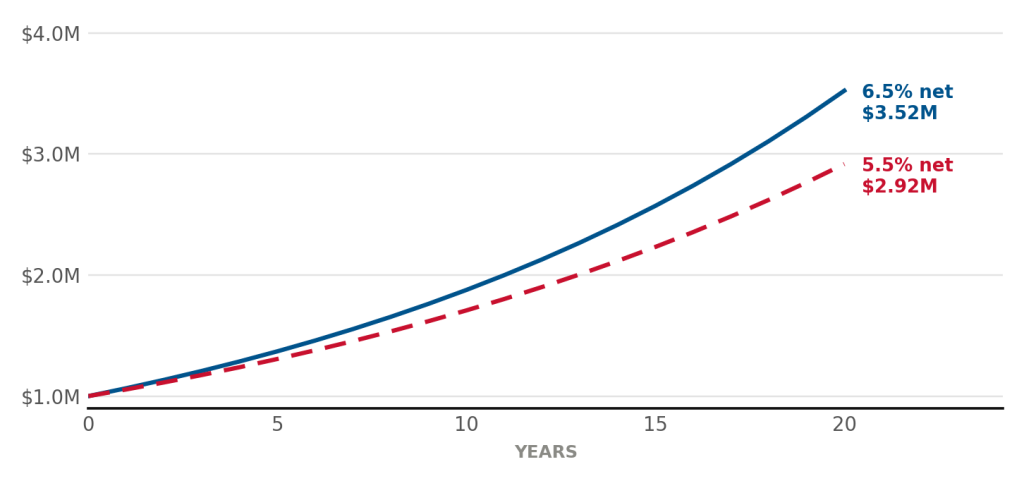
Note: Hypothetical illustration for educational purposes only. Not a projection and not the results of any actual account. Ending values $3,523,645 and $2,917,757; difference $605,888. See footnote 4.
Source: Panoramic Capital Partners calculations.
That is not a forecast. It is arithmetic. The arithmetic sets up an unflattering comparison. Investors will spend enormous energy pursuing an extra half of a percentage point of return, which is uncertain, competitive, and difficult. That same half of a percentage point is frequently available through tax construction, where it is none of those things. Yet one of them makes for better conversation than the other. Taxes compound against the investor exactly as returns compound for the investor.
The Cost of Activity
Two things drive that cost. The first is the character of the income. The second is the frequency with which gains are realized.
An investment strategy that actively trades converts appreciation that could have been held at no cost into gains that generate a tax liability. At short-term rates, that is the most expensive version. There is a second version, harder to see, familiar to anyone who has opened a year-end statement from a mutual fund that distributed capital gains in a year the fund itself declined. The tax was owed with no return to show for it. Turnover carries a cost that appears on no fee schedule.
None of which argues for holding a position simply because selling would trigger a bill. The point is not to trade less. It is to know what a trade costs before making it. Repositioning is frequently worth its tax bill. Harvesting a loss lowers the bill rather than raising it. Neither happens by accident, which is the distinction from the mutual fund above.
Same Strategy, Different Tax Bill
Everything to this point concerns what a portfolio owns. The question that follows is how the investment is owned, and it gets far less attention than it deserves. The same securities, selected by the same manager in pursuit of the same strategy, can leave an investor with materially different after-tax wealth depending on the structure they sit inside. Choosing the investment and choosing the vehicle are two separate decisions, and in most portfolios only the first one is made deliberately.
The mutual fund is the clearest case. A fund sells appreciated holdings for any number of reasons, among them a manager’s judgment that a position has reached full value and the need to raise cash for departing investors. Any such sale creates a gain, and the rules require the fund to pass that gain along to everyone still invested at year end. That is the mutual part of mutual funds; the gains get shared, including with an investor who bought in recently and earned none of the appreciation, and including in a year the fund itself declined. None of that reflects on a manager’s judgment, since it is a feature of the structure rather than a choice made inside it.
An exchange-traded fund holding those same securities handles its own buying and selling differently. Rather than selling positions for cash to meet redemptions, an ETF transfers baskets of the underlying shares in kind, so no taxable sale occurs inside the fund and there is generally nothing to distribute at year end. The structure is also not limited to indexing, which is the part most often assumed about it. Actively managed ETFs make the same security selection decisions an active mutual fund makes, with a manager exercising the same judgment, and they now exist across a growing number of asset classes. A strategy can be held either way, and the tax result is not the same.
One additional strategy worth naming here is direct indexing. Rather than holding an index through a single fund (i.e. – owning an S&P 500 index ETF), a direct index account owns a majority subset of the individual securities that make up the index, which means losses exist to harvest even in a year the index itself is up. These losses can be used to offset other capital gains (and can be rolled forward indefinitely to offset future capital gains if no capital gains exist in that given tax year). Example future capital gain events the losses can offset include a business sale, a concentrated position that has to be unwound, or simply other gains that are recognized as appreciated stock is sold to fund retirement.
To be clear, tax deferral is not tax avoidance. An unrealized gain is a liability postponed, not forgiven. Postponement is worth something nonetheless, since money not yet remitted to the IRS remains at work in the meantime. Where an account is likely to pass to children, the step-up in basis at death can convert deferral into something much closer to permanent relief under current law.⁵ Portfolio design and estate planning belong in the same conversation.
Where Real Assets Fit In
Two examples so far have addressed different halves of the problem. Municipal bonds are a question of the character of income. Fund structure and loss harvesting are a question of the timing of gains. Reading the code with both of those levers in view opens a further possibility, which is that some investments carry tax treatment built into the assets themselves, and understanding that treatment is often what brings an investor to look at alternative investments such as private real estate and private infrastructure in the first place.
Congress has long written the code to encourage the ownership of buildings, pipelines, and generation capacity, and the provisions it uses reach the owners of those assets in a way they do not reach the owner of a stock or a bond. Depreciation is the central one. The owner of a physical asset writes off its cost over time, with the result that taxable income reported to investors is frequently well below the cash actually received. The portion of a distribution not supported by taxable income is characterized as a return of capital, which is not taxed in the year received and instead reduces cost basis.
The exchange provisions operate one level up, at the asset manager’s discretion, and reach the investor through the fund. A manager who sells a property at a gain can reinvest the proceeds in another qualifying property under Section 1031 without triggering a current tax, so the full sale price stays invested and continues compounding rather than arriving at the investor’s return reduced by a tax bill in the year of the sale. Repositioning the portfolio and interrupting the investor’s compounding stop being the same event. An investor in a fund of this kind is buying access to the whole toolkit rather than one piece of it, exercised by a manager whose job includes knowing when each piece applies.
Both asset classes derive most of their return from contractual income: leases in the case of real estate, regulated or contracted revenue in the case of infrastructure. On the infrastructure side that revenue comes from the assets that generate and deliver power, chosen on the economics of the power itself. As illustrative examples among the semi-liquid funds currently available to individual investors, stated annualized distribution rates have recently fallen in the 6.0% to 6.5% range for private real estate and the 9.2% to 10.0% range for private infrastructure.⁶ A distribution rate is not a total return, and it is not guaranteed. Recent distributions from certain of these funds have been characterized as return of capital in full, though on the order of 75% is a more reasonable forward assumption.⁷ Expressed as the taxable yield an investor would need in order to keep the same amount of cash, the effect is considerable either way.⁸
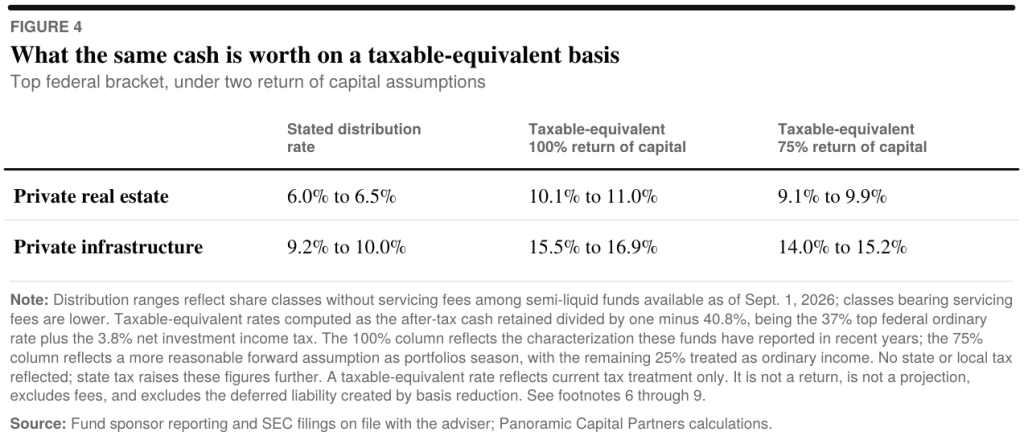
Disclaimer: Those figures are a ceiling rather than an expectation. Return of capital defers rather than eliminates, and the reduced basis returns as a larger gain on sale, potentially with depreciation recapture taxed above the long-term capital gain rate. The taxable-equivalent figures depend on how much of a distribution keeps that characterization, which no fund can promise, so the table shows both the historical 100% and the 75% assumption that looks more reasonable ahead. Funds of this kind are semi-liquid rather than daily liquid, offering periodic repurchase subject to program caps, board discretion, and early-redemption holdbacks, so a position should be sized on the assumption that access is periodic rather than immediate.9 Favorable tax treatment is a reason to examine a fund carefully. It is never on its own a reason to own one.
When the Tax Bill Starts Picking the Investments
Every good idea has a failure mode, and this one belongs to the investor who lets the tax bill make the investment decision: holding a deteriorating position to avoid a gain, staying concentrated in a low-basis holding because writing the check feels worse than bearing the risk, accepting limited liquidity purely for a tax characteristic. These are the same error wearing different hats.
Avoiding this mistake takes thoughtfulness rather than sophistication, and a small amount of thoughtfulness goes a considerable distance. Here’s our go-to investment framework to incorporate better tax decisions into the broader investment strategy:
- Start with what the money is for. Growth or income, and if income, beginning in which year? The answer comes from the household rather than from the market, and every dollar in the portfolio should have one. This ultimately comes from and ties back to your broader financial plan.
- Select the investments that accomplish it. Asset classes (i.e.- stocks, bonds, real estate), exposures, credit quality, the balance between public and private holdings, etc. At its core, this is where the traditional investment case is made or lost, and no tax feature rescues a position that fails this question.
- Choose the vehicle and the account that hold it. This covers everything from vehicle (i.e.- mutual funds vs ETF vs direct index), to state-specific vs national strategies for municipal bonds, to which account should hold which asset. There’s no one-size-fits-all approach.
Most of the industry spends its time on the second question, which is the interesting one and the one that comes up at the dinner party. However, an investment selected before the first question is answered is pointed at nothing in particular. An investment held without the third question answered hands back something in the neighborhood of a percentage point a year that nobody had to earn.
Bottom line, while tax conversations are rarely sexy, good decision making here is all about ensuring you keep what you earn.
As always, please feel free to reach out any time.
FOOTNOTES
1 The federal and state tax treatment of municipal bond interest depends on the issuer, the investor’s state of residence, and the specific bond. Certain municipal interest may be subject to the alternative minimum tax, and municipal bonds sold prior to maturity may generate capital gain or loss. Not all municipal interest is exempt in all states.
2 Illustration assumes the 37% top federal ordinary income rate and the 20% top long-term capital gain and qualified dividend rate, each increased by the 3.8% net investment income tax, applied to $1,000 of income. Computed as $1,000 x (1 – 0.408) = $592 and $1,000 x (1 – 0.238) = $762. Rates shown are statutory federal rates in effect as of the date of this article and are subject to change. The illustration does not reflect deductions, credits, phase-outs, the alternative minimum tax, the deductibility of state taxes, or any other feature of an individual return, and it assumes all income is taxed at the top marginal rate. Actual results will differ.
3 State treatment of investment income varies significantly. As of January 1, 2026, eight states levy no individual income tax at all: Alaska, Florida, Nevada, New Hampshire, South Dakota, Tennessee, Texas, and Wyoming. Among states that do levy one, top marginal rates for single filers range from 2.5% in Arizona and North Dakota to 13.3% in California. Washington taxes capital gains income only, at a top rate of 9%, and Missouri exempts capital gains from its income tax. The District of Columbia, which is not a state, would rank among the highest at 10.75%. Local income taxes, which apply in roughly ten states, are excluded. Source: Tax Foundation, “State Individual Income Tax Rates and Brackets, 2026,” published February 17, 2026, reflecting data as of February 11, 2026. Rates shown are top marginal rates on ordinary income unless otherwise noted and do not reflect differing state treatment of capital gains, dividends, or municipal interest. Figure 1 excludes state tax entirely; investors should evaluate their own state’s treatment with a qualified tax advisor.
4 Hypothetical illustration for educational purposes only. Assumes a constant 7% annual return before taxes, annual tax drag of 1.5 and 0.5 percentage points respectively, and no contributions, withdrawals, or fees. Computed as $1,000,000 x 1.055^20 = $2,917,757 and $1,000,000 x 1.065^20 = $3,523,645; difference $605,888, rounded. The assumed drag levels are illustrative assumptions and are not derived from the results of any portfolio, strategy, or client account. This is not a projection or a performance record, does not represent the results of any actual investment, and no investor should expect these results. Actual returns and tax outcomes will vary and may be negative.
5 Reflects current federal law regarding basis adjustment at death. Estate and income tax law is subject to legislative change.
6 Distribution rate ranges reflect stated annualized distribution rates as of September 1, 2026 for share classes without distribution or shareholder servicing fees among semi-liquid private real estate and private infrastructure funds available on Panoramic’s platform. Rates are drawn from fund-sponsor reporting and from distribution and net asset value figures disclosed in fund filings with the Securities and Exchange Commission, and are on file with the adviser. Where a sponsor does not publish an annualized rate, Panoramic computed it as the most recent declared monthly distribution multiplied by twelve, divided by the most recently reported net asset value per share. Ranges are illustrative of the two asset classes generally and are not an offer, a recommendation, or a representation regarding any fund. Rates for share classes bearing servicing fees are lower. Individual fund rates vary widely and change over time. Distributions may be funded from sources other than operating cash flow, including borrowings, return of capital, offering proceeds, and adviser fee waivers subject to later reimbursement, and in the cases underlying these ranges have exceeded net income under GAAP.
7 Certain semi-liquid private real estate and private infrastructure funds have reported that 100% of their distributions were classified as a return of capital in each of the past several years. Supporting sponsor disclosures are on file with the adviser. The characterization of any distribution is determined annually by the issuer and reported to the investor after year end. The share treated as return of capital generally declines as a portfolio matures, and a figure on the order of 75% is a more reasonable forward assumption than a continuation of 100%. No figure, historical or assumed, should be relied on as a prediction.
8 Taxable-equivalent rates computed by Panoramic as the after-tax cash retained from a distribution divided by one minus 40.8%, being the 37% top federal ordinary income rate plus the 3.8% net investment income tax. Two return of capital assumptions are shown. At 100%, no portion of the distribution is currently taxed and the taxable-equivalent rates are: 6.0% distribution, 10.14%; 6.5%, 10.98%; 9.2%, 15.54%; 10.0%, 16.89%. At 75%, the remaining 25% is treated as ordinary income taxed at 40.8%, and the taxable-equivalent rates are: 6.0%, 9.10%; 6.5%, 9.86%; 9.2%, 13.96%; 10.0%, 15.17%. Figures shown in the table are rounded. No state or local tax is reflected, and no assumption is made regarding any particular state; state tax, where it applies, raises these figures further. A taxable-equivalent rate is a comparison of current tax treatment only. It is not a return, is not a projection, does not reflect fees, and does not reflect the deferred liability created by basis reduction. Not intended as tax advice.
9 Funds of this kind report to shareholders on Form 1099 rather than Schedule K-1. They offer periodic share repurchase rather than daily liquidity, subject to program caps, board or adviser discretion to amend or suspend the program, and early-redemption holdbacks for shares held less than one year. Semi-liquid does not mean liquid, and repurchase requests may be limited or unavailable in a given period. Terms vary by fund and are described in each fund’s offering documents.
IMPORTANT DISCLOSURES
Panoramic Capital Partners LLC (“Panoramic”) is a Registered Investment Adviser.
This content is intended to provide general information about Panoramic. It is not intended to offer or deliver investment advice in any way. Information regarding investment services are provided solely to gain an understanding of our investment philosophy, our strategies and to be able to contact us for further information.
All information has been obtained from sources believed to be reliable, but its accuracy is not guaranteed. There is no representation or warranty as to the current accuracy, reliability or completeness of, nor liability for, decisions based on such information and it should not be relied on as such.
The views expressed in this commentary are subject to change based on market and other conditions. These documents may contain certain statements that may be deemed forward-looking statements. Please note that any such statements are not guarantees of any future performance and actual results or developments may differ materially from those projected. Any projections, market outlooks, or estimates are based upon certain assumptions and should not be construed as indicative of actual events that will occur.
Past performance is no guarantee of future returns. Diversification does not ensure against loss.
Different types of investments involve varying degrees of risk. Therefore, it should not be assumed that future performance of any specific investment or investment strategy will be profitable.
Panoramic Capital Partners LLC, its affiliates, and its employees are not in the business of providing tax or legal advice. These materials and any tax-related statements are not intended or written to be used, and cannot be used or relied upon, by any taxpayer for the purpose of avoiding tax penalties. Tax-related statements, if any, may have been written in connection with the “promotion or marketing” of the transaction(s) or matter(s) addressed by these materials, to the extent allowed by applicable law. Any taxpayer should seek advice based on the taxpayer’s particular circumstances from an independent tax advisor.
This material is provided for educational and informational purposes only. It is not intended to be an offer, solicitation, or recommendation with respect to the purchase or sale of any security. The views expressed in these educational and related publication(s) contain the judgment of the author(s) as the publication date is subject to change without notice.
All illustrations contained here are hypothetical, are provided for educational purposes only, and do not represent the performance of any actual account, portfolio, or strategy. Hypothetical illustrations have inherent limitations and are not a guarantee or projection of future results.
Private real estate and private infrastructure funds involve substantial risk and are suitable only for investors who can bear the loss of their entire investment. Such funds are semi-liquid rather than liquid: they offer periodic repurchase at the discretion of the board or adviser, subject to program caps, potential suspension, and early-redemption holdbacks, and an investor should not assume shares can be sold when desired. They may carry higher fees and expenses than publicly traded alternatives, may employ leverage, and provide less frequent valuation and less transparency than listed securities. Distributions are not guaranteed, may be funded from sources other than operating cash flow, and may be reduced or suspended. Availability is generally limited to investors meeting applicable eligibility standards. Any investment should be made only after review of a fund’s prospectus or offering documents, which contain complete information regarding risks, fees, liquidity terms, and tax treatment.
Additional Important Disclosures may be found in the Panoramic Form ADV Part 2A online.
Panoramic Capital Partners (“Panoramic”) is a registered investment advisor.
The information provided is for educational, informational, and illustrative purposes only and does not constitute investment advice and it should not be relied on as such. It should not be considered a solicitation to buy or an offer to sell a security. It does not take into account any investor’s particular investment objectives, strategies, tax status or investment horizon. Panoramic Capital Partners and its advisors do not provide legal, accounting, or tax advice. You should consult your attorney or tax advisor.
The views expressed in this commentary are subject to change based on market and other conditions. This article may contain certain statements that may be deemed forward looking statements. Please note that any such statements are not guarantees of any future performance and actual results or developments may differ materially from those projected. Any projections, market outlooks, or estimates are based upon certain assumptions and should not be construed as indicative of actual events that will occur.
All information has been obtained from sources believed to be reliable, but its accuracy is not guaranteed. There is no representation or warranty as to the current accuracy, reliability, or completeness of, nor liability for, decisions based on such information and it should not be relied on as such.
Advisory services are only offered to clients or prospective clients where Panoramic and its representatives are properly licensed or exempt from licensure.
The above targets are estimates based on certain assumptions and analysis made by the advisor. There is no guarantee that the estimates will be achieved.