
The Full Picture
Sharing stories and strategies on building businesses, investing capital, and the personal side of wealth
By Panoramic Capital Partners
Every two years the country votes, and every two years investors wonder what the election season means for their portfolio. While it is a fair question, like most questions about the future, the answer can be less concrete than we would like. What midterms offer is a long term record to analyze rather than a short term forecast to extrapolate. They have been happening every two years since 1788, so there is plenty of history to examine. None of that history predicts this November. It does show what has usually happened around elections, which is where we would rather start. With election season in its final stretch, we went through more than 90 years of S&P 500 history. Some of the election statistics you will see this fall are well grounded. Others rest on a handful of elections and deserve a more critical eye. Below we sort one from the other.
MIDTERM YEARS HAVE BEEN SLOWER, NOT BAD
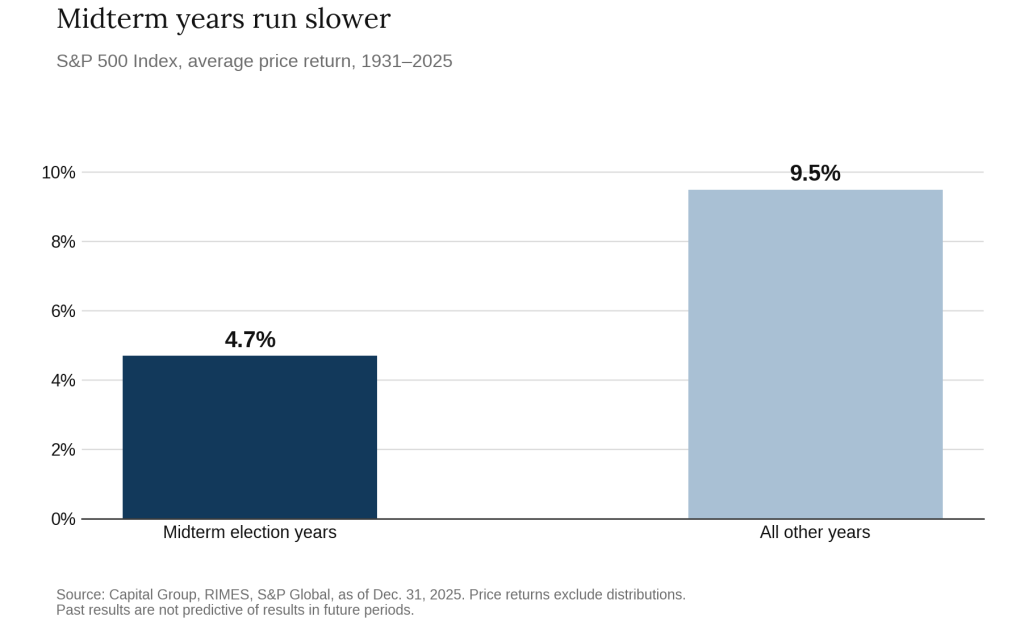
Since 1931, the S&P 500 has returned an average of 4.7% in midterm election years versus 9.5% in non-midterm years. Lower than average, but still a modest gain. The usual explanation is that markets dislike uncertainty, and an election supplies a steady year of it.
This year has been notably better than average rather than worse. Very true: through the 3rd quarter, the S&P 500 was up 11.8%, more than double the midterm-year average and even ahead of the 9.5% figure for all other years. These averages describe what has happened across nine decades. They do not describe what has to happen in any single year, and 2026 is a good reminder of that. Some of the stock market’s recent strength may have borrowed from future years rather than added to them. Perhaps worth keeping in mind.
THE RESULT IS USUALLY EXPECTED
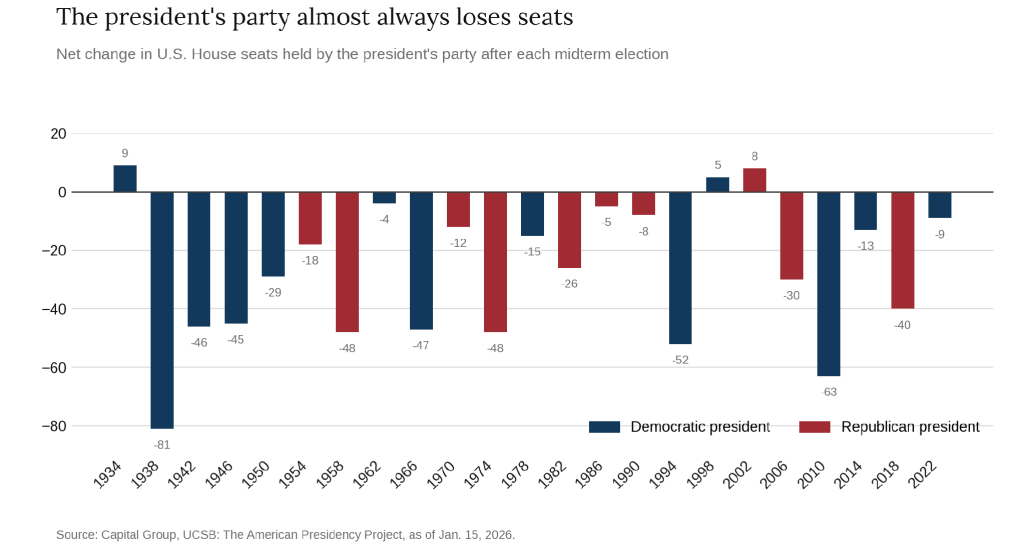
Much of what November will decide is already visible. Since 1934, the president’s party has lost seats in the House in all but three midterm elections, and the average loss is 27 seats. Very little in politics is that consistent. When investors can see something coming from that far off, they tend to account for it long before it happens, which is why the result itself rarely moves markets much. What is still unknown is how large the shift turns out to be, and what legislation may follow from it. That is a much narrower question than the news coverage in October would have us believe.
THE TURBULENCE IS REAL, AND IT IS CONCENTRATED
THE GAIN HAS TENDED TO ARRIVE LATE IN THE YEAR
Looking at midterm years from 1982 through 2022, the S&P 500 lost ground in each of the first three quarters and then gained 6.6% in the final three months of the year. That is the typical shape of a midterm year, and it is worth knowing because you will likely see it cited frequently between now and early November. 2026 has not followed this storyline. This year was already up 11.8% through the third quarter, so the fourth quarter begins from a very different place than the one below.
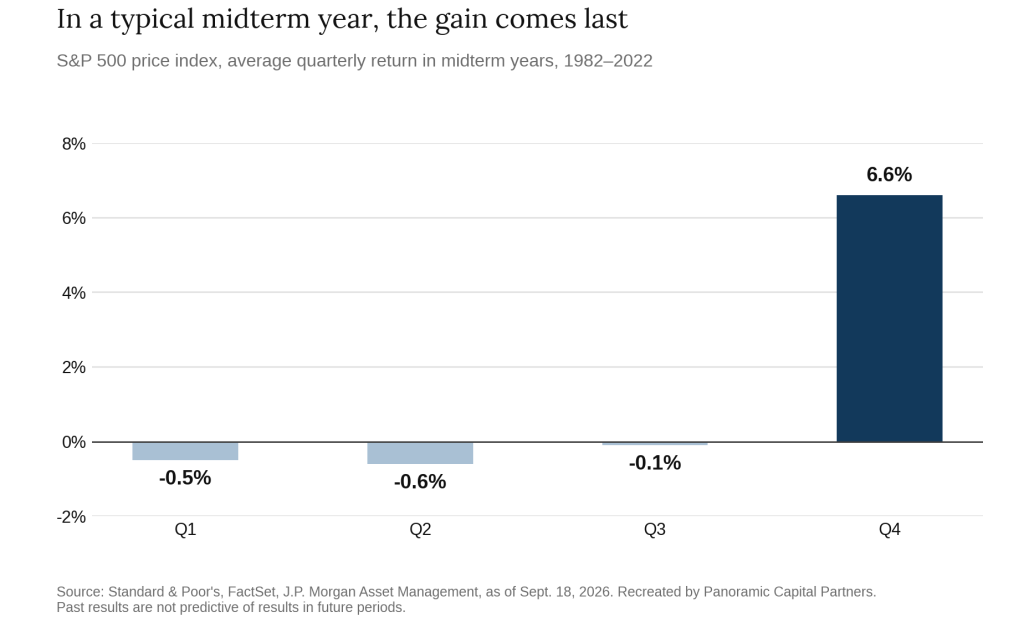
Two things are worth knowing about that average. Eleven elections is a small sample, and the average hides a wide range of individual results, some good and some much less so. The chart is insightful precisely because this year departs from it. Knowing the usual pattern is what lets you see that 2026 has not been following expectations. History like this is useful background but it is not a plan, which is why we would not recommend basing portfolio decisions around it.
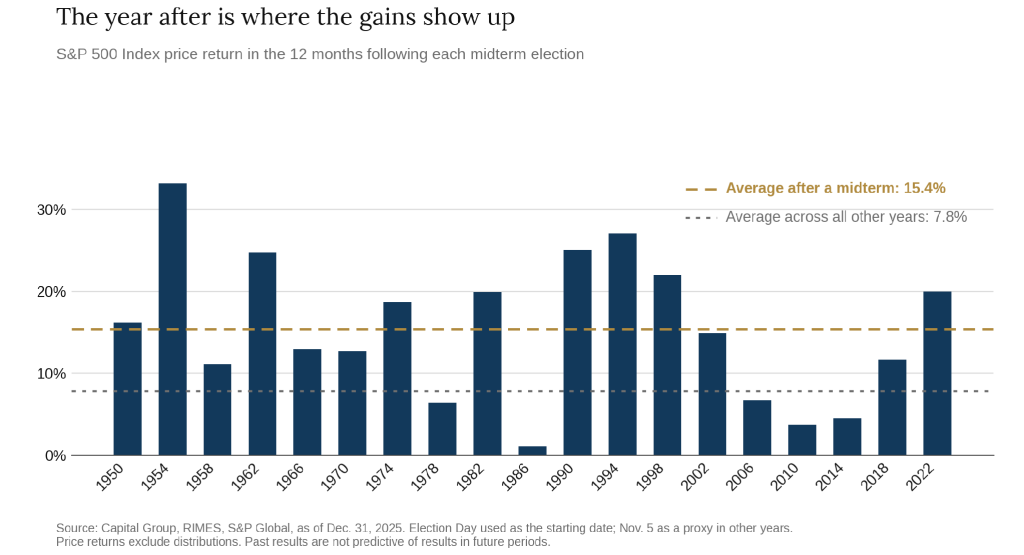
THE YEAR AFTER HAS TENDED TO BE THE STRONGER ONE
Since 1950, the average S&P 500 return in the 12 months following a midterm election was 15.4%, compared with 7.8% in all other years.
Between now and November you will likely see a related claim: that it makes little difference to markets which party controls Congress. The long record does support that, but different studies group the results differently and reach different conclusions, so the finding is less certain than it is often implied. There is a larger reason for caution. That comparison was built over decades when more of what moved markets had to pass through Congress first. By contrast, much of the policy impacting markets now, tariffs in particular, is being set through this White House’s extensive use of executive action rather than through legislation. Congressional control still matters a great deal for taxes and spending. We would simply not assume the historical pattern transfers cleanly to a period that has operated differently during the past couple of years.
Averages also hide the years that hurt. 2018 and 2022 were both midterm years, and the S&P 500 fell 4.4% and 18.1% in those years. Neither decline had much to do with the election. Rising interest rates caused both. None of this is a prediction, and this cycle has its own set of pressures: tariffs, inflation, interest rates, global growth, and a political environment more bitterly divided than any of us can remember.
If any of this has you thinking about selling now and buying back in after the tallies have been counted, that is the idea we would question most. J.P. Morgan finds that markets have usually started rising a little less than a month before Election Day, no matter which party wins. The rally often begins before anyone knows the outcome. To benefit from it you would have to be right twice, once when you sell and once again when you buy back in, and there is no second chance at either.
There is a related concern we hear much more often than the election itself, and the two can sometimes get conflated. A 10% decline is an ordinary event rather than a warning sign. Capital Group studied market declines going back to 1954 and found that the S&P 500 falls at least 10% about once every 18 months, and 20% or more about once every six years. Those declines arrive on their own schedule and pay no attention to the political calendar. The reason it belongs in a note about the midterms is that if a correction does show up next spring, it will be tempting to trace it back to November. The record suggests it would have very little to do with the election, and a great deal to do with the ordinary behavior of markets.
What the long term record suggests is that the discomfort of an election year and the long term results of a portfolio have very little to do with one another. The people who get hurt in these stretches are rarely the ones who read the wrong polls. They are the ones who let a political opinion turn into a decision about their money.
If anything here raises a question about your own portfolio, we would be happy to talk it through when the time is right for you.
IMPORTANT DISCLOSURES
Panoramic Capital Partners LLC (“Panoramic”) is a Registered Investment Adviser.
This content is intended to provide general information about Panoramic. It is not intended to offer or deliver investment advice in any way. Information regarding investment services are provided solely to gain an understanding of our investment philosophy, our strategies and to be able to contact us for further information.
All information has been obtained from sources believed to be reliable, but its accuracy is not guaranteed. There is no representation or warranty as to the current accuracy, reliability or completeness of, nor liability for, decisions based on such information and it should not be relied on as such.
The views expressed in this commentary are subject to change based on market and other conditions. These documents may contain certain statements that may be deemed forward-looking statements. Please note that any such statements are not guarantees of any future performance and actual results or developments may differ materially from those projected. Any projections, market outlooks, or estimates are based upon certain assumptions and should not be construed as indicative of actual events that will occur.
Past performance is no guarantee of future returns. Diversification does not ensure against loss.
Different types of investments involve varying degrees of risk. Therefore, it should not be assumed that future performance of any specific investment or investment strategy will be profitable.
Panoramic Capital Partners LLC, its affiliates, and its employees are not in the business of providing tax or legal advice. These materials and any tax-related statements are not intended or written to be used, and cannot be used or relied upon, by any taxpayer for the purpose of avoiding tax penalties. Tax-related statements, if any, may have been written in connection with the “promotion or marketing” of the transaction(s) or matter(s) addressed by these materials, to the extent allowed by applicable law. Any taxpayer should seek advice based on the taxpayer’s particular circumstances from an independent tax advisor.
This material is provided for educational and informational purposes only. It is not intended to be an offer, solicitation, or recommendation with respect to the purchase or sale of any security. The views expressed in these educational and related publication(s) contain the judgment of the author(s) as the publication date is subject to change without notice.
All illustrations contained here are hypothetical, are provided for educational purposes only, and do not represent the performance of any actual account, portfolio, or strategy. Hypothetical illustrations have inherent limitations and are not a guarantee or projection of future results.
Private real estate and private infrastructure funds involve substantial risk and are suitable only for investors who can bear the loss of their entire investment. Such funds are semi-liquid rather than liquid: they offer periodic repurchase at the discretion of the board or adviser, subject to program caps, potential suspension, and early-redemption holdbacks, and an investor should not assume shares can be sold when desired. They may carry higher fees and expenses than publicly traded alternatives, may employ leverage, and provide less frequent valuation and less transparency than listed securities. Distributions are not guaranteed, may be funded from sources other than operating cash flow, and may be reduced or suspended. Availability is generally limited to investors meeting applicable eligibility standards. Any investment should be made only after review of a fund’s prospectus or offering documents, which contain complete information regarding risks, fees, liquidity terms, and tax treatment.
Additional Important Disclosures may be found in the Panoramic Form ADV Part 2A online.
Panoramic Capital Partners (“Panoramic”) is a registered investment advisor.
The information provided is for educational, informational, and illustrative purposes only and does not constitute investment advice and it should not be relied on as such. It should not be considered a solicitation to buy or an offer to sell a security. It does not take into account any investor’s particular investment objectives, strategies, tax status or investment horizon. Panoramic Capital Partners and its advisors do not provide legal, accounting, or tax advice. You should consult your attorney or tax advisor.
The views expressed in this commentary are subject to change based on market and other conditions. This article may contain certain statements that may be deemed forward looking statements. Please note that any such statements are not guarantees of any future performance and actual results or developments may differ materially from those projected. Any projections, market outlooks, or estimates are based upon certain assumptions and should not be construed as indicative of actual events that will occur.
All information has been obtained from sources believed to be reliable, but its accuracy is not guaranteed. There is no representation or warranty as to the current accuracy, reliability, or completeness of, nor liability for, decisions based on such information and it should not be relied on as such.
Advisory services are only offered to clients or prospective clients where Panoramic and its representatives are properly licensed or exempt from licensure.
The above targets are estimates based on certain assumptions and analysis made by the advisor. There is no guarantee that the estimates will be achieved.