By Panoramic Capital Partners
The $8M Cash Blindside
A manufacturing business owner sat in our office, confident about their cash position. They were launching new products for several major customers and projected they’d maintain their typical $4M cash balance through the transition.
Two weeks of detailed work later, we had a very different picture: The business would actually deplete that $4M and need an additional $4M to get through the cash trough – an $8M total gap between their projection and reality.
This gap would have killed the company.
How could they be so far off? They were experienced operators with years in business. They understood their industry.
The Problem: They didn’t have product-level financial modeling showing the actual profitability and cash dynamics of each new product launch.
They were looking at top-line revenue projections – “$40M in new product revenue over the next 18 months” – without understanding the underlying economics. The new products had significantly higher input costs than their historical business. Material costs were 15-20 percentage points higher. Lead times were longer, creating working capital build that didn’t exist in their legacy products.
They were growing, but the liquidity required for that growth wasn’t keeping up and they couldn’t see it coming.
The Solution: We built granular, product-by-product financial modeling that showed the true cash dynamics. This gave the operators visibility into the impending crisis – and more importantly, showed them exactly where to push operationally to fix it.
Armed with this data, they increased pricing via negotiations with customers, worked with customers and suppliers to reduce input costs through design changes, and adjusted payment terms to better manage working capital.
The business survived and now thrives.
This is the power of performance reporting done right. It’s not about creating beautiful dashboards. It’s about having visibility into what’s actually happening in your business – both what’s already occurred and what’s coming next – so you can make decisions before problems become crises.
Where We Are in the NorthStar System
In our NorthStar Value Creation System series, we’ve covered:
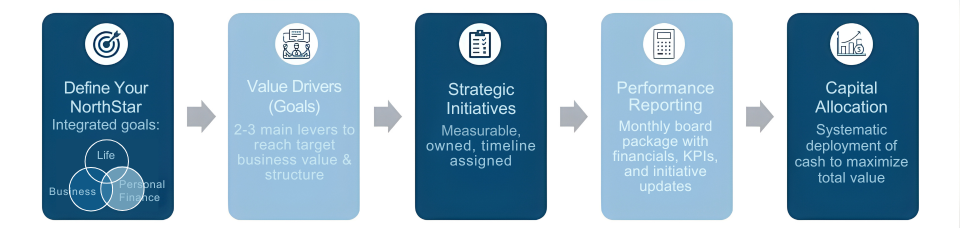
- Defining Your NorthStar: your integrated business value, personal financial, and life goals
- Value Drivers: the 2-4 specific, measurable levers that will increase enterprise value
- Strategic Initiatives: the specific work to pull those levers
- Today: Performance Reporting: the dashboard that tells you if the work is translating into results
- Next: Capital Allocation: where you systematically deploy every dollar to maximize total value
Performance reporting is where you gain visibility and control. Without it, you’re executing Strategic Initiatives blindly, hoping they’re working. With it, you know whether your efforts are moving your Value Drivers and building enterprise value.
The Two Types of Business Information
To understand performance reporting, you need to understand that there are two fundamentally different types of business information.
Backward-Looking: Financial Statements
Your P&L, Balance Sheet, and Cash Flow Statement tell you what already happened. October’s financials tell you how October went. These are essential – you need accurate, timely financial statements to know where you stand.
But they’re insufficient for running a business. By the time revenue declines show up in your P&L, you’ve already lost weeks or months of opportunity to course-correct.
Financial statements are the scoreboard. They tell you if you won or lost. But you can’t win the game by only looking at the scoreboard.
Forward-Looking: KPIs (Key Performance Indicators)
KPIs are leading indicators – they tell you what’s happening right now and what’s likely to happen next.
Your sales pipeline tells you what revenue is coming in 60-90 days. Customer churn rate tells you if revenue retention is slipping before it hits your P&L. Inventory turns tell you if working capital is about to spike. Backlog tells you if you have work lined up.
KPIs give you visibility to act before problems show up in financial statements.
You Need Both
Financials without KPIs = driving by looking only in the rearview mirror
KPIs without financials = no accountability to actual results
Together, they form your complete performance reporting system.
The Structural Connection: How KPIs Actually Work
Here’s what most business owners get wrong about KPIs: They pick metrics that seem important but don’t connect to what they’re actually doing.
The result? Lots of data, no action.
The Critical Principle: We don’t track KPIs tha don’t have Strategic Initiatives behind them to actively influence the results.
Why? Because tracking without action is just data collection. The point of performance reporting isn’t to observe your business – it’s to inform decisions and drive behavior.
The Right Approach:
- Define your Value Drivers (specific, measurable targets)
- Create Strategic Initiatives to achieve those Value Drivers
- Identify the KPI for each Strategic Initiative that measures if it’s working
- Roll those initiative-level KPIs up to 1-2 Value Driver-level metrics
Example of the Complete Connection:
Value Driver: Top 3 customers represent <35% of total revenue by end of 2027
Value Driver-Level KPI: % revenue from top 3 customers (this measures exactly what the driver states)
Strategic Initiatives to achieve this:
- Initiative: Hire business development manager by Q2 2025 (Owner: CEO)
- Initiative KPI: Position filled (Y/N), then BDM’s pipeline $ in new vertical
- Initiative: Launch outbound campaign targeting 50 prospects in healthcare vertical by Q3 (Owner: BDM)
- Initiative KPI: Number of target prospects contacted and qualified
- Initiative: Develop case studies and sales materials for healthcare vertical by Q1 (Owner: Marketing)
- Initiative KPI: Number of case studies completed (target: 3)
- Initiative: Implement CRM with all prospect data by Q2 (Owner: COO)
- Initiative KPI: % of prospect data complete in CRM
See the connection? The Strategic Initiative KPIs measure whether you’re doing the work. The Value Driver KPI measures whether that work is translating into business results.
In your monthly review, you track both. If all your initiatives are green but your Value Driver KPI isn’t moving, you know you’re doing the wrong work. If your initiatives are behind schedule, you know why your Value Driver isn’t progressing.
Building Your Monthly Board Package
Your monthly board package brings together financial performance and KPI tracking in one place. It should be concise enough to actually get done every month.
The Target: 5-7 pages, less than 2 hours to prepare, less than 45 minutes to review
The Structure:
Page 1: Executive Summary – 3-6 bullets covering highlights, concerns, and critical decisions needed
Page 2: Financial Review
Your P&L structured with both monthly and year-to-date views:
- Actual | Budget | Delta
- Actual | Prior Year | Delta
- Growth rate %, Gross Margin %, EBITDA Margin % shown as line items
- Key cost line items shown as % of revenue (to understand what’s driving margin changes)
- Brief commentary explaining any variance >10%
Page 3: Strategic Initiatives & KPIs by Value Driver
For each Value Driver, show:
- The Value Driver target
- The Value Driver KPI (current status vs. target)
- All Strategic Initiatives under that driver with their KPIs, status, and % complete
- Brief update on yellow/red items
Page 4 (Optional): Monitoring KPIs
Health check metrics not tied to active initiatives – these help ensure we don’t need to suddenly shift attention to a brewing problem in the business (customer churn, backlog, DSO, employee turnover)
This structure is comprehensive without being overwhelming. Someone can read the executive summary in 5 minutes and understand the complete picture.
The Meeting Cadence
Performance reporting isn’t just about creating documents – it’s about the discipline of regular business review.
Monthly Operating Review (45-60 minutes)
Attendees: Owner + CFO/controller + department heads who own Strategic Initiatives
Agenda:
- 5 min: Financial review vs. budget and prior year
- 20 min: Strategic initiative status by Value Driver (focus yellow/red only)
- 10 min: Value Driver-level KPIs (are initiatives translating to results?)
- 10 min: Discussion and decisions
This is “sausage making” – the operational work of keeping execution on track.
The results of this work are frequently pushed to a monthly Board financial review call to keep the Board up to speed on monthly performance.
Quarterly Board Meeting (2-3 hours)
Attendees: Owner + full leadership team + external advisors
Agenda:
- Quarterly financial review (trends, not just one month)
- Full-year re-forecast based on YTD
- Deep dive on Value Drivers (still the right levers?)
- Strategic initiative review (what needs to change?)
- Forward-looking discussion
This is strategic review, not operational firefighting.
The Power of “Telling the Story”
One of the most underappreciated aspects of performance reporting: The act of having to explain results drives improved performance.
When your CFO knows they’ll present financial results every month, they pay closer attention throughout the month. When your head of sales knows they’ll explain pipeline metrics, the pipeline gets managed proactively.
But it goes deeper than that. The discipline of telling the story – of having to articulate what’s happening and why – feeds back into the business and creates operational changes that drive the business forward. When your team knows they’ll need to explain variances and progress, they start asking better questions, tracking more carefully, and making adjustments before problems compound.
This isn’t surveillance – it’s clarity. Everyone knows what matters, what we’re doing about it, how we’re measuring success, and when we’re reviewing progress.
This also:
- Elevates your management team (they’re presenting their areas, building leadership capability)
- Creates accountability without micromanagement (they own the “how,” you measure the “what”)
- Forces regular business review (catches issues when they’re easier to fix)
The cash trough story from the opening – we caught it with time to execute fixes. Without detailed performance reporting, they would have discovered the problem when the bank account hit zero.
That’s the difference between a problem you can solve and a crisis that kills your business.
Common Mistakes to Avoid
Mistake #1: Tracking KPIs Without Initiatives Behind Them
If you’re measuring something but not doing anything to change it, you’re just scorekeeping. Start with Strategic Initiatives, then pick KPIs for each.
Mistake #2: Only Tracking Lagging Indicators
Revenue and EBITDA show results of actions taken months ago. You need leading indicators: pipeline metrics, conversion rates, backlog, early indicators of customer churn.
Mistake #3: Making It Too Complicated
If your board package takes 10 hours to prepare and is 30 pages long, it won’t get done consistently. Keep it simple and sustainable.
Mistake #4: No Commentary
Raw numbers without context are meaningless. Every significant variance (>10%) requires a brief explanation.
Mistake #5: Not Actually Reviewing It
Put the monthly meeting on the calendar for the entire year right now. Make it non-negotiable. If you’re not reviewing monthly with discipline, you’re not doing performance reporting – you’re just creating documents.
Your Action Steps
This Week:
- Audit your financial reporting – accurate, timely P&L monthly with budget and prior year comparisons?
- Review your Strategic Initiatives – do you have a specific KPI for each?
This Month:
- For each Strategic Initiative, define the specific KPI
- For each Value Driver, identify 1-2 roll-up metrics
- Pick 3-5 monitoring KPIs for health checks
- Build your monthly board package template
This Quarter:
- Schedule monthly financial review calls for the next 12 months (put them on the calendar now)
- Schedule quarterly board meetings (last month of each quarter, 2-3 hours)
- Run your first monthly review (it will be rough – that’s expected)
Start simple. Track your KPIs manually in a spreadsheet if you have to. Get the discipline of monthly review established first. Add technology later when the manual process becomes the bottleneck.
The Bridge to Capital Allocation
You now have four of the five components of the NorthStar system:
- ✓ Your NorthStar (where you’re headed)
- ✓ Your Value Drivers (the levers to get there)
- ✓ Your Strategic Initiatives (the work to pull those levers)
- ✓ Your Performance Reporting (the dashboard showing if it’s working)
The final piece: Capital Allocation – where you systematically decide how to deploy every dollar of cash flow your business generates.
This is where the entire system comes together – where business strategy meets personal wealth creation.
Your performance reporting tells you where you’re ahead and behind on Value Drivers, which initiatives need more resources, and whether you’re on track. Capital Allocation uses this information to make deliberate decisions: reinvest in the business, pay down debt, make distributions to build personal wealth, pursue acquisitions, or buy out co-owners.
Most business owners make these decisions reactively and emotionally. The NorthStar system makes capital allocation systematic, strategic, and intentional – recognizing that business cash flow and personal wealth aren’t separate things. They’re one integrated system.
We’ll cover exactly how to do this in our next article.
The Bottom Line
Performance reporting isn’t about perfect dashboards or sophisticated BI tools. It’s about building the discipline of regular business review so you catch problems early, make better decisions based on real data, and hold people accountable without micromanaging.
Your Strategic Initiatives are the work. Your Performance Reporting is how you know if that work is actually creating value.
The businesses that build enterprise value are the ones that measure what matters, review it consistently, and adjust quickly when things go off track.
That’s the power of performance reporting done right.
Panoramic Capital Partners (“Panoramic”) is a registered investment advisor.
The information provided is for educational, informational, and illustrative purposes only and does not constitute investment advice and it should not be relied on as such. It should not be considered a solicitation to buy or an offer to sell a security. It does not take into account any investor’s particular investment objectives, strategies, tax status or investment horizon. Panoramic Capital Partners and its advisors do not provide legal, accounting, or tax advice. You should consult your attorney or tax advisor.
The views expressed in this commentary are subject to change based on market and other conditions. This article may contain certain statements that may be deemed forward looking statements. Please note that any such statements are not guarantees of any future performance and actual results or developments may differ materially from those projected. Any projections, market outlooks, or estimates are based upon certain assumptions and should not be construed as indicative of actual events that will occur.
All information has been obtained from sources believed to be reliable, but its accuracy is not guaranteed. There is no representation or warranty as to the current accuracy, reliability, or completeness of, nor liability for, decisions based on such information and it should not be relied on as such.
Advisory services are only offered to clients or prospective clients where Panoramic and its representatives are properly licensed or exempt from licensure.